Download Schlumberger PD Plot 7.1 – Advanced Pressure vs. Depth Analysis Tool
Schlumberger PD Plot 7.1 is a specialized reservoir analysis software developed by Schlumberger Limited, a global leader in oilfield services. This petroleum software is designed to significantly enhance the efficiency and accuracy of pressure versus depth analysis within the oil and gas industry. It provides critical insights into reservoir characteristics, aiding engineers in making more informed decisions for reservoir management.
Introduction to PD Plot 7.1
PD Plot 7.1 serves as an essential tool for geoscientists and reservoir engineers in the oil and gas sector. Developed by Schlumberger, it streamlines complex tasks related to understanding subsurface conditions. The software’s primary function revolves around advanced pressure versus depth plotting, a cornerstone of reservoir analysis. Its ability to integrate fluid density calculations further solidifies its importance for professionals aiming for precise reservoir interpretation and management.
Key Features and Capabilities
Reservoir Fluid Calculations
This module within PD Plot 7.1 is dedicated to performing detailed calculations for various reservoir fluids. It accurately determines the densities of gas, oil, and water under specific reservoir conditions. These precise fluid density calculations are fundamental to understanding fluid behavior, distribution, and contribution within the reservoir, directly impacting production forecasting and well integrity assessments.
Pressure vs. Depth Analysis
The core functionality of PD Plot 7.1 lies in its sophisticated pressure versus depth plotting capabilities. This feature is critical for characterizing reservoir formations and identifying key geological boundaries such as fluid contacts and pore pressure gradients. By accurately plotting pressure against depth, engineers can diagnose reservoir quality, detect potential influxes, and validate geological models, providing crucial data for development planning.
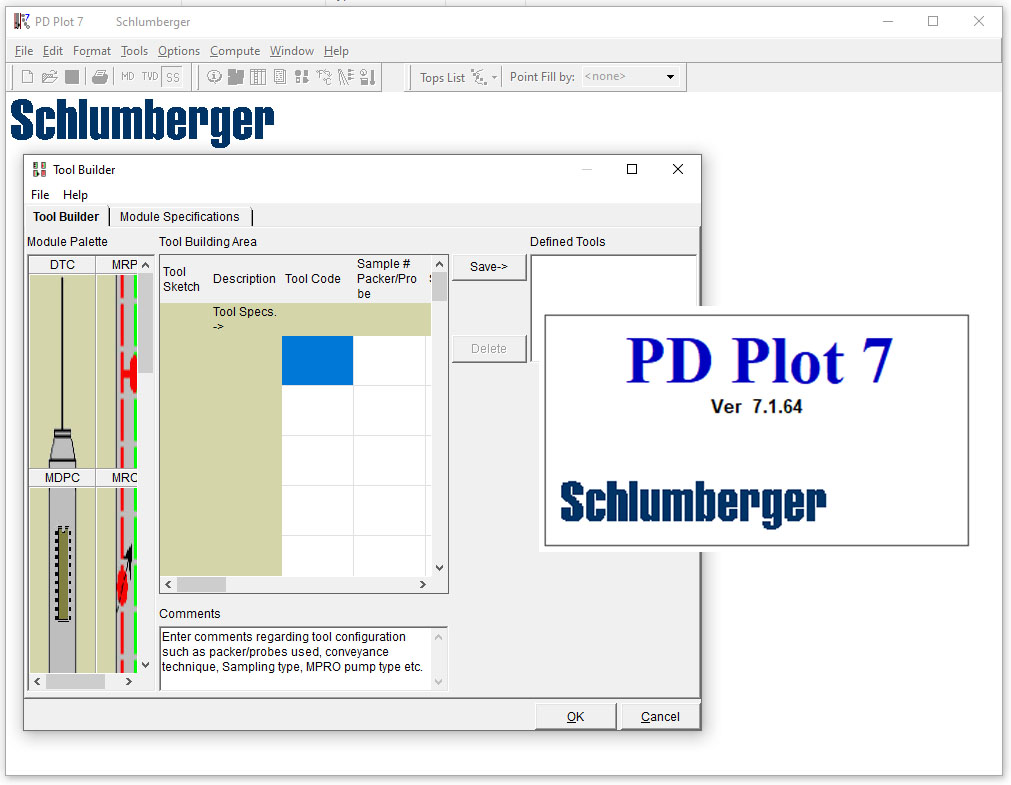
User Interface and Charting Capabilities
PD Plot 7.1 features an intuitive user interface designed for efficient data visualization and analysis. It allows users to easily display and compare data from single or multiple wells on a unified chart. The software supports layering additional data, such as seismic horizons or well logs, onto the pressure-depth plots, offering a comprehensive view of the subsurface environment and enhancing the integration of diverse datasets for a holistic interpretation.
Use Cases in the Oil and Gas Industry
In the demanding oil and gas industry, PD Plot 7.1 is applied in several critical scenarios to drive better decision-making. It aids in understanding reservoir compartmentalization by analyzing pressure regimes across adjacent wells. Furthermore, the software is instrumental in the early detection of formation integrity issues during drilling operations by providing real-time pressure data interpretation. Reservoir engineers also utilize its plotting features for production allocation studies and for monitoring reservoir depletion over time.
Comparison with Other Reservoir Analysis Tools
Compared to general charting software, PD Plot 7.1 offers specialized functionalities tailored for reservoir analysis. While other petroleum software might provide broader simulation capabilities, PD Plot 7.1 excels in its focused approach to pressure-depth plotting and fluid density calculations. Its strength lies in its efficiency and direct application to critical reservoir interpretation workflows, enabling faster and more accurate analysis for Schlumberger software users and engineers.
Frequently Asked Questions
What is Schlumberger PD Plot 7.1 used for?
Schlumberger PD Plot 7.1 is primarily used for plotting and analyzing the relationship between petroleum reservoir pressure and depth. It enables engineers to perform detailed reservoir fluid density calculations that enhance analysis accuracy.
How does PD Plot 7.1 improve analysis time for engineers?
PD Plot 7.1 streamlines data presentation, allowing users to focus more on interpretation rather than preparation. By providing intuitive graphics and detailed well data on a unified chart, it significantly reduces the time spent on data processing.
Can PD Plot 7.1 be used with multiple wells simultaneously?
Yes, PD Plot 7.1 allows users to display single and multiple wells on the same chart, which facilitates comparative analysis and better visualization of reservoir information.


Reviews
There are no reviews yet.