Download TeeChart Pro VCL-FMX 2021.33 – Advanced Charting Library for Developers
TeeChart Pro VCL-FMX 2021.33, developed by Steema Software, is a sophisticated charting library designed for software developers. It provides extensive capabilities for creating a wide array of charts, making it a powerful tool for data visualization within various applications. This library is particularly suitable for professionals in the software development and data visualization fields who require detailed and interactive graphical representations of data.
Introduction to TeeChart Pro
Overview and History
TeeChart is a mature charting library that has been available since 1995, with continuous development and evolution by Steema Software. Its journey has seen it adapt to numerous programming environments and technology shifts. The VCL (Visual Component Library) and FMX (FireMonkey) versions specifically cater to Delphi and C++Builder developers, offering broad compatibility.
Key Features and Capabilities
Comprehensive Charting Options
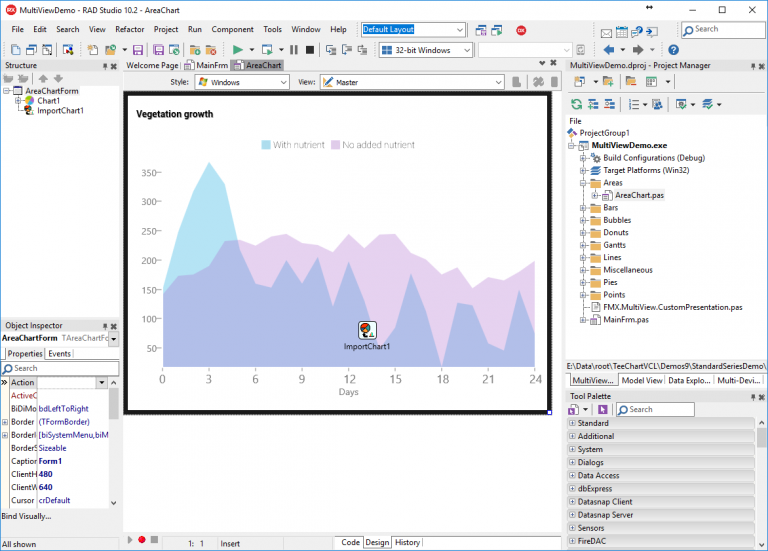
The library offers an extensive collection of chart types, enabling developers to create visualizations for nearly any data set. This includes a wide array of 2D and 3D chart styles.
- Support for over 60 different 2D and 3D chart types, such as line, bar, area, point, bubble, pie, and radar charts.
- Advanced 3D rendering capabilities with customizable lighting and camera controls.
- Tools for creating statistical and financial charts, including candlestick, histogram, and MACD.
Integration and Compatibility
TeeChart Pro is designed for broad compatibility, facilitating seamless integration into diverse development workflows across multiple platforms.
- Native support for Delphi and C++Builder environments, including VCL and FMX frameworks for Windows, macOS, iOS, Android, and Linux development.
- Compatibility with various programming languages and environments, including .NET (C#, VB.NET), Java, and JavaScript.
- Extensive customization options allow developers to tailor the appearance and behavior of charts to specific application requirements.
Use Cases in Software Development
Applications in Financial and Scientific Analytics
The robust feature set of TeeChart Pro makes it an ideal choice for applications demanding precise and informative data representation in specialized fields.
- In financial analytics, TeeChart can be used to build sophisticated trading platforms with real-time stock charts, portfolio analysis tools, and performance dashboards.
- Scientific data processing benefits from TeeChart’s ability to visualize complex datasets, experimental results, and simulation outputs with high accuracy.
- It facilitates the creation of analytical tools for business intelligence, enabling users to track key performance indicators (KPIs) and market trends through interactive reports.
Real-Time Data Visualization
TeeChart Pro excels in scenarios requiring immediate visual feedback, making it suitable for dynamic and interactive applications.
- Developers can implement real-time plotting capabilities to display live data streams from sensors, financial markets, or system monitoring tools.
- The library supports high-speed data updates and interactive features such as zooming, panning, and data point selection, enhancing user engagement.
- It is instrumental in creating dashboards that offer up-to-the-minute insights into operational status and performance metrics.
User Experience and Interface Design
Object-Oriented Architecture
The library’s design is rooted in object-oriented principles, providing developers with a flexible and manageable structure for incorporating charting functionalities.
- An object-oriented approach allows for easy manipulation of chart elements, series, axes, and tools as distinct objects.
- This architecture promotes code reusability and maintainability within complex software projects.
- Developers can leverage inheritance and polymorphism to extend or modify charting behaviors according to specific project needs.
Ease of Use and Customization
TeeChart Pro balances powerful functionality with developer-friendliness, offering tools that simplify chart creation and customization.
- Intuitive design tools and wizards assist developers in setting up charts quickly.
- Extensive properties and methods provide granular control over every aspect of chart appearance, from individual data points to overall thematic styles.
- The ability to export charts in various formats (e.g., image files, PDF, XML) aids in report generation and presentation.
Documentation and Community Support
Resources Available for Developers
Steema Software provides comprehensive resources to support developers in leveraging the full potential of TeeChart Pro.
- Detailed documentation covers all aspects of the library, including API references, tutorials, and conceptual explanations.
- Numerous example projects demonstrate various charting techniques and customization options across different supported platforms.
- Code samples are readily available, illustrating practical implementation patterns for common visualization tasks.
Community and Language Support
TeeChart’s global reach is extended through its multilingual support and an active developer community.
- The library is localized into 38 languages, making it accessible to a diverse international user base.
- This language support ensures that development environments and chart output can be presented in the user’s native language, enhancing usability.
- While specific forum details are not provided, the availability in multiple languages suggests a broad developer network likely exists.
Comparison with Similar Tools
Positioning in the Charting Library Landscape
TeeChart Pro VCL-FMX distinguishes itself within the charting library market through its comprehensive feature set and multi-platform compatibility.
- Compared to simpler charting components, TeeChart offers a deeper level of customization and a wider variety of chart types, including advanced 3D and statistical options.
- Its strength lies in its native support for Delphi and C++Builder (VCL/FMX), providing a highly integrated experience for developers using these environments, which may be a key differentiator from cross-platform libraries with less native integration.
- While other libraries might focus on specific niches like web-based charting, TeeChart provides a robust solution for desktop and mobile applications, emphasizing interactive capabilities and real-time data handling.
Frequently Asked Questions
What types of charts can I create with TeeChart Pro?
TeeChart Pro supports over 60 different chart types including line, bar, area, point, bubble, and many more. This variety enables developers to visualize data in engaging and informative ways tailored to specific needs, ensuring that complex datasets can be represented effectively.
How do I integrate TeeChart with my development environment?
TeeChart is designed to integrate seamlessly with several IDEs including Delphi, C++, and Visual Studio .NET. Developers can utilize its object-oriented architecture to easily incorporate charts into their applications, often through component installation directly within the IDE.
Is TeeChart Pro available for mobile application development?
Yes, TeeChart Pro includes support for mobile environments, allowing developers to create applications for Android and iOS devices while maintaining powerful data visualization capabilities through the FMX framework.


Reviews
There are no reviews yet.