Download PeakLab 1.08 – Advanced Peak Modeling Software for Spectroscopy and Chromatography Analysis
PeakLab 1.08 is a specialized peak modeling software designed for advanced analysis of spectral and chromatographic data. Developed to address complex challenges in analytical chemistry, this tool is essential for professionals in fields such as pharmaceutical research, materials science, and instrumentation engineering. It provides sophisticated capabilities for peak fitting, modeling, and deconvolution, crucial for extracting precise quantitative and qualitative information from scientific measurements using its advanced peak modeling software for spectroscopy features.
Comprehensive Peak Analysis in Chemical and Material Sciences
In analytical chemistry, spectroscopy, and chromatography, the accurate interpretation of data often relies on meticulous peak analysis. Overlapping signals in spectral and chromatographic data can obscure important details, making robust peak modeling essential for scientific research and industrial applications. PeakLab provides a dedicated solution for these challenges, enabling researchers to resolve complex signal deconvolution and gain deeper insights into the composition and properties of their samples.
Diverse Peak Fitting Models and Instrument Response Function Analysis
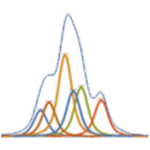
PeakLab supports a wide array of sophisticated peak fitting models necessary for accurately representing spectral and chromatographic peaks. This includes standard profiles such as Gaussian, Lorentzian, and Voigt, alongside specialized asymmetric peak shapes and user-defined models. A key capability is the genetic algorithm-driven deconvolution of the instrument response function, which allows users to correct for distortions introduced by the analytical instrumentation itself. This advanced approach ensures that the analyzed peaks reflect the true sample characteristics rather than instrumental artifacts, offering a more precise representation of experimental results.
Integration of Chemometric and Statistical Analysis Tools
Beyond basic peak fitting, PeakLab integrates powerful chemometric and statistical analysis tools to handle complex data sets. Its nonlinear statistical analysis capabilities facilitate in-depth data mining and the development of predictive models from multivariate data. The software features statistical histogram fitting, incorporating numerous probability functions for rigorous data distribution analysis. Furthermore, its capacity for multi-dataset batch processing streamlines the analysis of numerous samples or experimental conditions, making it efficient for high-throughput laboratories and advanced research projects within the realm of chemometric software.
Applications Across Spectral and Chromatographic Techniques
This advanced spectral data analysis tool is versatile, finding application across a broad spectrum of analytical techniques. PeakLab is adept at analyzing data from spectroscopy methods like X-ray Photoelectron Spectroscopy (XPS), Raman spectroscopy, Nuclear Magnetic Resonance (NMR), and Fourier-transform Infrared Spectroscopy (FTIR). It also excels in chromatography peak fitting for High-Performance Liquid Chromatography (HPLC) and Gas Chromatography (GC) data. Real-world use cases include detailed analysis of pharmaceutical compounds, characterization of novel materials, and research into complex chemical mixtures, supporting scientists in making informed decisions based on precise analytical results.
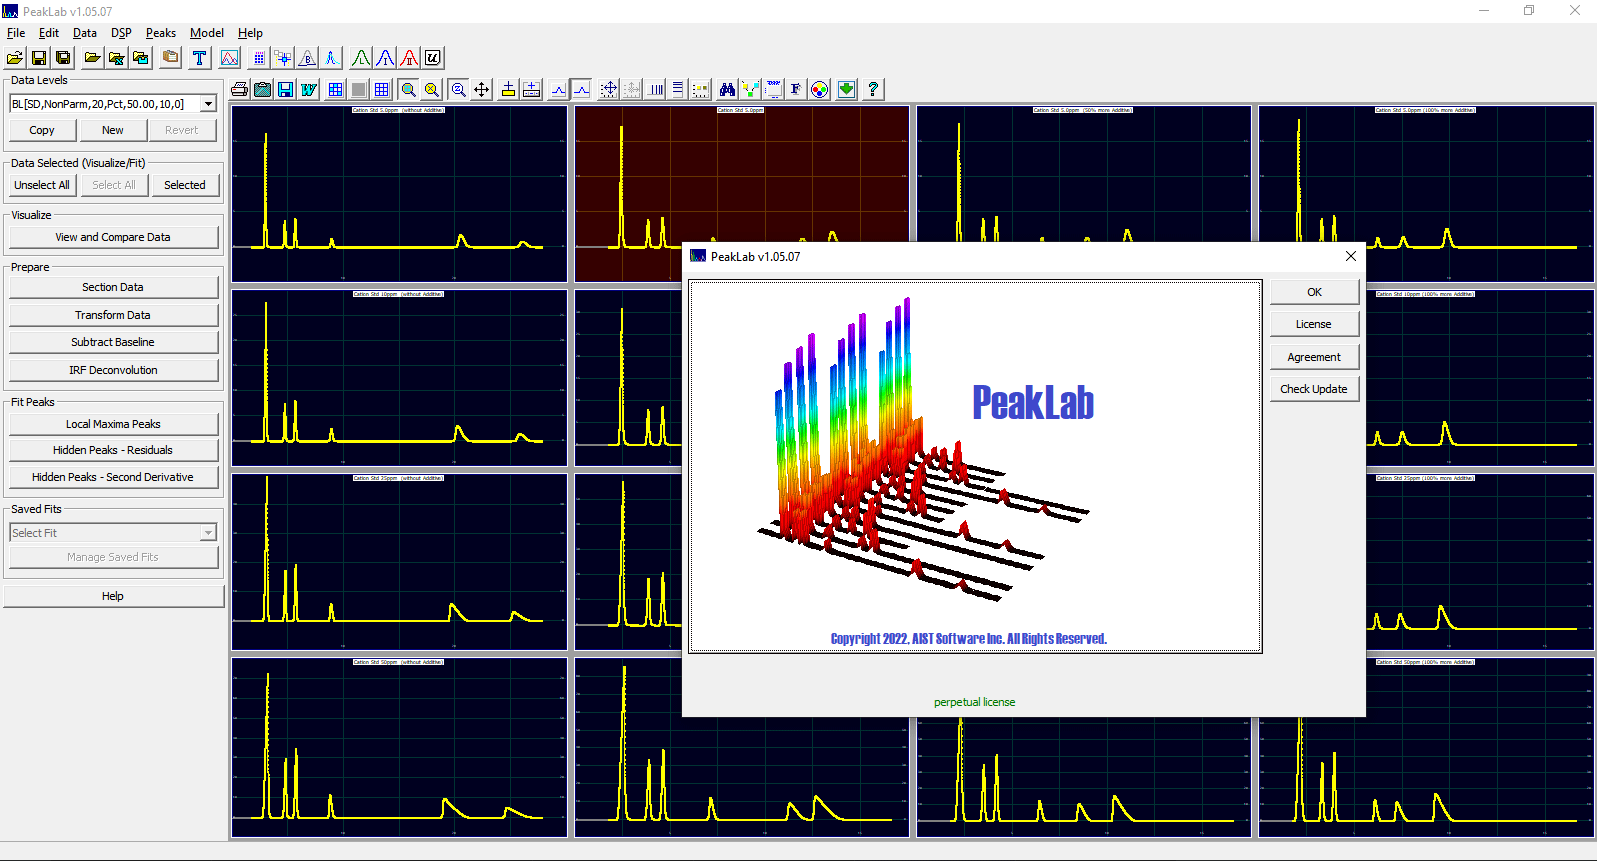
Interactive Interface and Scientific Visualization
PeakLab features an interactive user interface designed to enhance workflow efficiency and data interpretation. It allows for seamless management of multiple datasets, making it easier to organize and process complex analytical projects. Essential data preprocessing functions such as baseline correction and smoothing are integrated to prepare data for modeling. The software also provides high-resolution graphing capabilities, enabling users to create clear, scientifically accurate visualizations of their fitted peaks, deconvoluted spectra, and statistical models, which is fundamental for reporting and validation in analytical chemistry software.
Frequently Asked Questions
How does PeakLab improve the accuracy of spectral data analysis?
PeakLab employs advanced peak fitting models and utilizes genetic algorithms for instrument response deconvolution. This process effectively corrects distortions inherent to measurement devices, thereby significantly enhancing the accuracy and reliability of spectral data analysis for quantitative and qualitative insights.
What types of data can PeakLab analyze?
PeakLab is versatile and supports the analysis of diverse spectroscopic data, including XPS, Raman, NMR, and FTIR. Additionally, it handles chromatography data such as HPLC and GC, making it a suitable tool for a wide range of applications within chemical and material science research.
Can PeakLab handle multiple datasets simultaneously?
Yes, PeakLab is equipped with batch multi-dataset fitting capabilities and interactive graphical tools. These features facilitate the efficient processing, comparison, and analysis of numerous experimental data sets within a single, integrated session.


Reviews
There are no reviews yet.