
Download Visual OTTHYMO 6.2 – Hydrological Modeling for Urban Stormwater and Drainage Systems
Visual OTTHYMO 6.2 is a specialized hydrological modeling software designed for analyzing urban stormwater and drainage systems. Developed with a focus on the OTTHYMO methodology, it is utilized by hydrological engineers and urban planners to simulate complex rainfall-runoff processes and manage water resources effectively within urban environments.
Overview of Visual OTTHYMO and Its Role in Urban Hydrology
Visual OTTHYMO is a powerful tool for engineers and planners focused on understanding how precipitation interacts with urban landscapes. The software employs the established OTTHYMO methodology, which is particularly suited for analyzing watershed conditions common in temperate climates, such as those found in Canada. Its application extends to both urban and rural watershed analysis, providing critical insights for effective water management and infrastructure design.
Advanced Simulation Capabilities for Rainfall-Runoff and Drainage Networks
The core functionality of Visual OTTHYMO 6.2 lies in its comprehensive simulation capabilities. It meticulously models the distinct phases of the hydrological cycle relevant to urban environments:
- Rainfall-Runoff Modeling: Simulates the generation of surface runoff from precipitation events based on land cover, soil type, and storm characteristics.
- Infiltration and Evapotranspiration: Accounts for water loss through soil infiltration and evaporation from surfaces and vegetation.
- Dynamic Routing: Models the movement and accumulation of water flow through complex urban drainage networks, including pipes, channels, and storage units.
These integrated processes allow for a realistic depiction of water behavior within a watershed during various storm conditions.
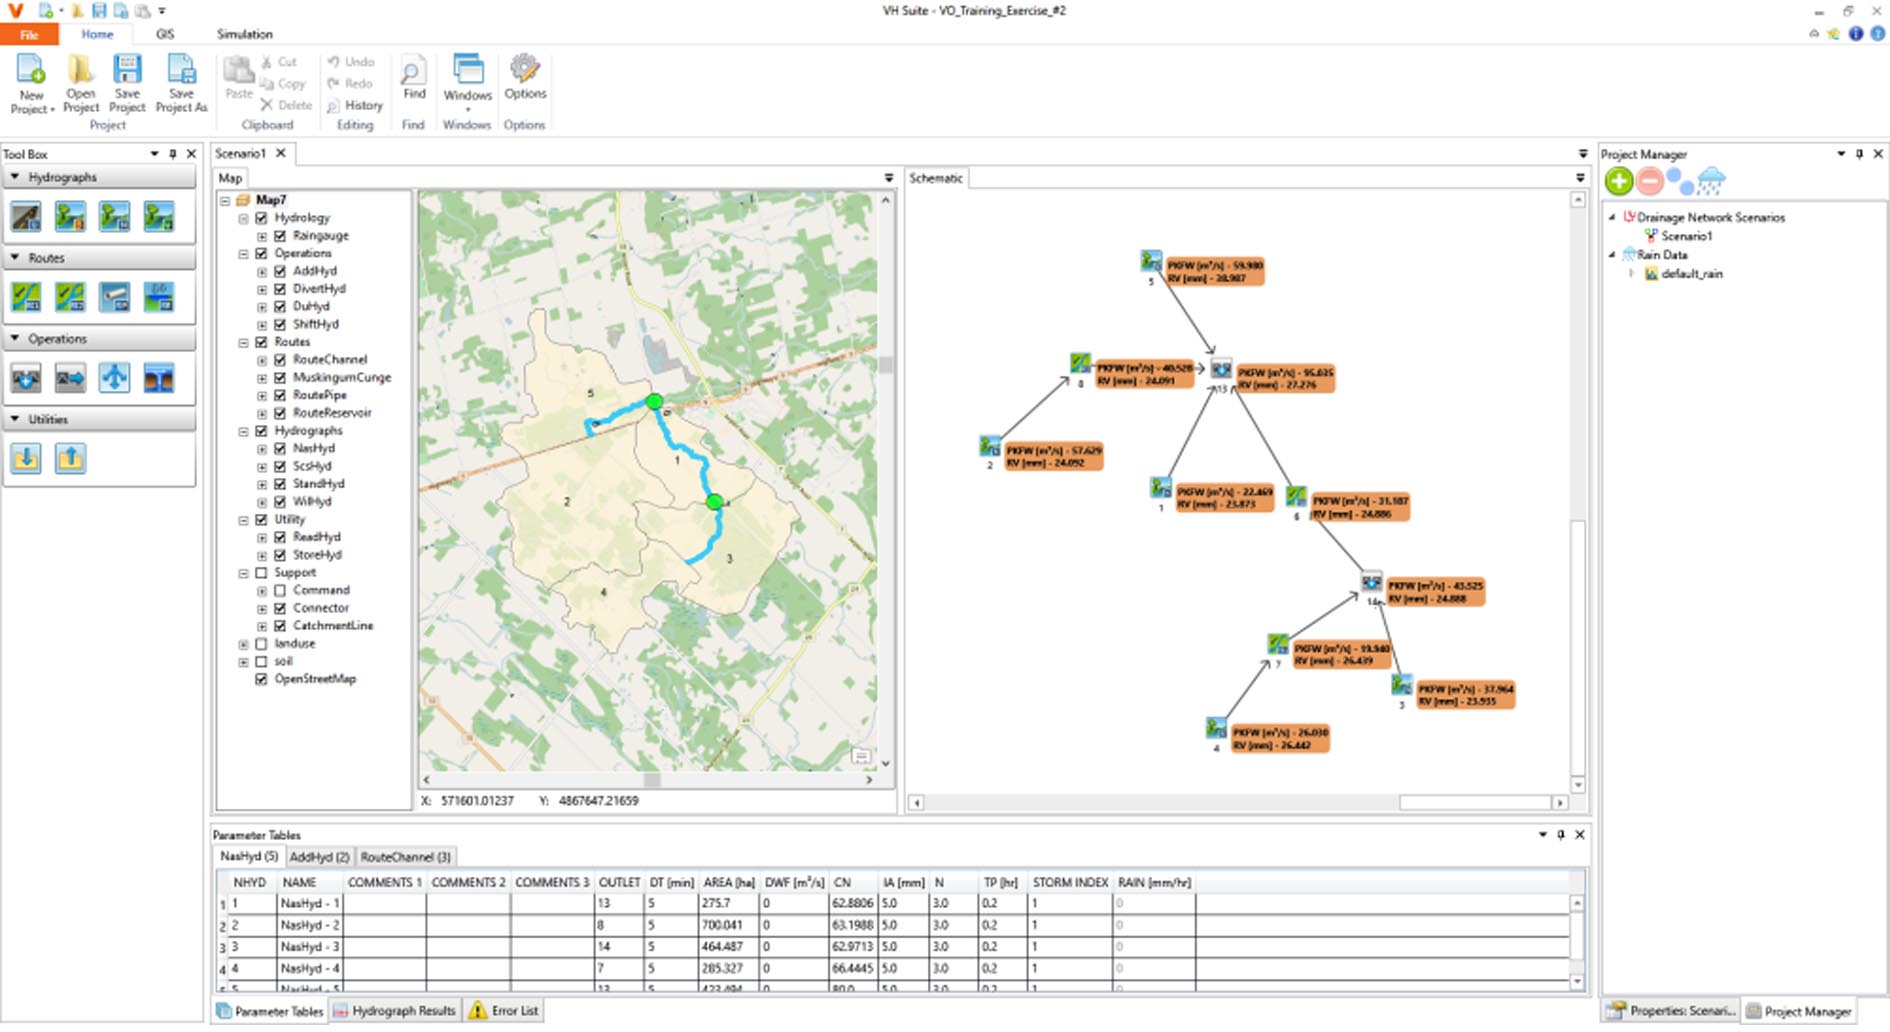
Integration with GIS, CAD, and Climate Data for Accurate Watershed Modeling
Visual OTTHYMO 6.2 enhances modeling accuracy through robust integration with common geospatial and meteorological data sources. This capability is crucial for creating realistic digital representations of study areas and applying relevant environmental data:
- GIS Data Import: Supports various Geographic Information System (GIS) data formats, enabling the import of land use, soil maps, and existing infrastructure data to define subcatchments and watershed boundaries.
- CAD Drawing Compatibility: Allows for the import of Computer-Aided Design (CAD) files, facilitating the incorporation of detailed engineering designs for drainage networks.
- Digital Elevation Models (DEMs): Utilizes DEMs to accurately delineate topography, derive watershed characteristics, and analyze flow paths.
- Climate Data Integration: Works with Intensity-Duration-Frequency (IDF) curves and historical or projected climate scenarios to simulate responses to a wide range of rainfall events.
Urban Stormwater Quality and Best Management Practices Evaluation
Beyond water quantity, Visual OTTHYMO 6.2 addresses the critical aspect of urban stormwater quality. It provides tools to simulate the impact of pollutants and evaluate mitigation strategies:
- Pollutant Buildup and Washoff Simulation: Models the accumulation of pollutants on urban surfaces during dry periods and their subsequent transport into the drainage system during storms.
- Best Management Practices (BMPs) Analysis: Enables the assessment of various structural and non-structural BMPs, such as detention ponds, green roofs, and permeable pavements, to reduce pollutant loads and manage runoff volumes.
This dual focus on quantity and quality makes it an indispensable tool for comprehensive stormwater management and compliance with environmental regulations.
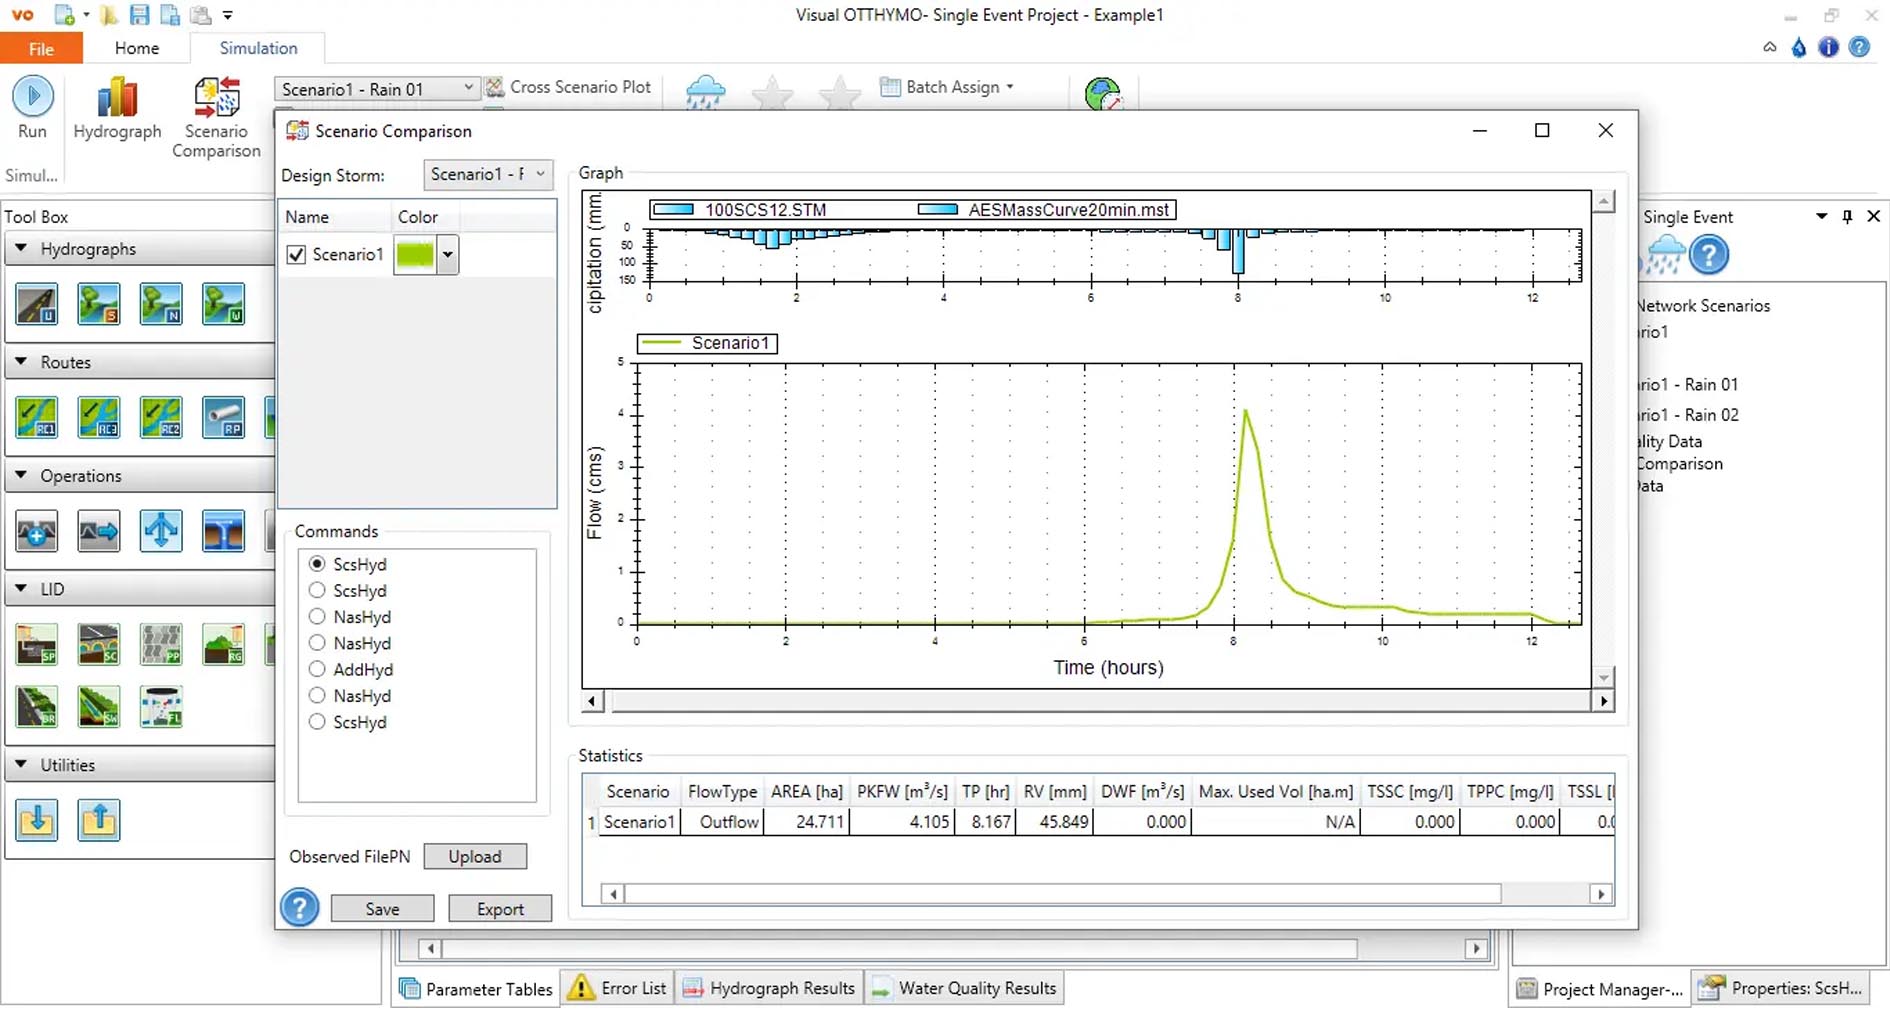
Scenario Analysis and Reporting Tools for Effective Design Decisions
Visual OTTHYMO 6.2 empowers users to explore multiple design alternatives and make informed decisions through its advanced scenario analysis and reporting features. The software’s capabilities streamline the evaluation process:
- Multi-Scenario Management: Allows users to create, manage, and compare different design options, such as varying pipe sizes, land use changes, or BMP selections, within a single project file.
- Comparison Capabilities: Facilitates direct comparison of simulation results across various scenarios to identify optimal solutions for quantity and quality objectives.
- Customizable Reports: Generates detailed, configurable reports that summarize simulation outputs, including flow rates, water levels, pollutant concentrations, and BMP effectiveness.
- Visualization Outputs: Provides graphical representations of simulation results, such as hydrographs, longitudinal profiles, and watershed pollutant loads, aiding in the understanding and communication of findings.
What’s New in Visual OTTHYMO 6.2
The latest release, Visual OTTHYMO 6.2, introduces several enhancements designed to improve user experience and analytical power. These updates reflect ongoing development to meet the evolving needs of hydrological engineers and urban planners:
- Improved User Interface: Features a modernized and more intuitive graphical user interface (GUI) for easier navigation and data input.
- Performance Optimizations: Incorporates faster processing speeds for complex simulations, reducing computation time.
- Data Import Expansions: Offers expanded support for various data formats, further streamlining the integration of external datasets.
- Enhanced Reporting Templates: Introduces updated and more versatile reporting templates for clearer presentation of simulation results and design recommendations.
Frequently Asked Questions
What types of hydrological processes can Visual OTTHYMO 6.2 simulate?
Visual OTTHYMO 6.2 simulates various hydrological processes including rainfall-runoff, infiltration, evapotranspiration, and routing flows through urban drainage networks. It is designed for detailed stormwater and urban watershed analysis.
How does Visual OTTHYMO integrate external data like GIS and climate information?
The software supports importing GIS data formats, CAD drawings, and digital elevation models to create accurate watershed delineations. It also incorporates Intensity-Duration-Frequency (IDF) curves and climate change scenarios for realistic rainfall input.
Who are the primary users of Visual OTTHYMO 6.2?
Primary users include hydrological engineers, urban drainage planners, municipal engineers, water resource consultants, and environmental regulators who focus on urban stormwater management and drainage system design.


Reviews
There are no reviews yet.