
Download Golden Software Grapher – Powerful Graphing Tool for Professionals
Golden Software Grapher is a specialized graphing software developed by Golden Software, LLC, designed for professionals in scientific, engineering, education, and research fields. It empowers users to create a wide array of publication-quality graphs and visual data representations, essential for presenting complex data clearly and effectively. The software is a key tool for effectively managing and visualizing data, making it indispensable for detailed analysis and reporting in technical disciplines.
Overview of Golden Software Grapher
Golden Software Grapher is a robust application engineered to transform raw data into insightful visual formats. It caters to users who require precise control over their charts and graphs, offering extensive customization options. This graphing software is ideal for generating sophisticated visual aids that meet the rigorous standards of scientific publications, engineering reports, and academic research, ensuring that data is not only presented but also clearly understood.
Key Features of Golden Software Grapher
Grapher offers a comprehensive suite of tools to create, customize, and automate the generation of diverse charts. Its flexibility allows users to tailor visualizations to specific analytical needs, enhancing the clarity and impact of their data presentations.
- Supports over 60 unique 2D and 3D chart types, including line, bar, scatter, and specialized plots like polar and logarithmic axes.
- Features an intuitive Graph Wizard to guide users through chart creation and customization.
- Provides extensive options for formatting axes, labels, legends, and annotations for professional-grade output.
- Includes advanced capabilities such as curve fitting, regression analysis, and data manipulation tools directly within the charting environment.
- Offers automation through Script Recording, allowing users to record and repeat sequences of actions for increased efficiency in repetitive graphing tasks.
Applications in Various Fields
The versatility of Golden Software Grapher makes it an invaluable asset across numerous technical and academic disciplines. Its ability to produce clear, accurate, and visually compelling graphs supports critical work in research, development, and education.
- Scientific Research: Used for visualizing experimental data, geological surveys, and complex scientific phenomena in publications and presentations.
- Engineering: Essential for creating performance charts, stress analysis graphs, and project progress visualizations in engineering reports.
- Education: Serves as an effective tool for instructors and students to illustrate mathematical concepts, statistical data, and scientific principles.
- Data Analysis: Empowers analysts to explore datasets, identify trends, and communicate findings through detailed charts and plots.
Efficient Data Visualization Techniques
Grapher provides users with the means to go beyond standard chart types, enabling sophisticated data representation techniques that illuminate complex relationships within datasets. Effective use of its features can significantly enhance the interpretability of research and findings.
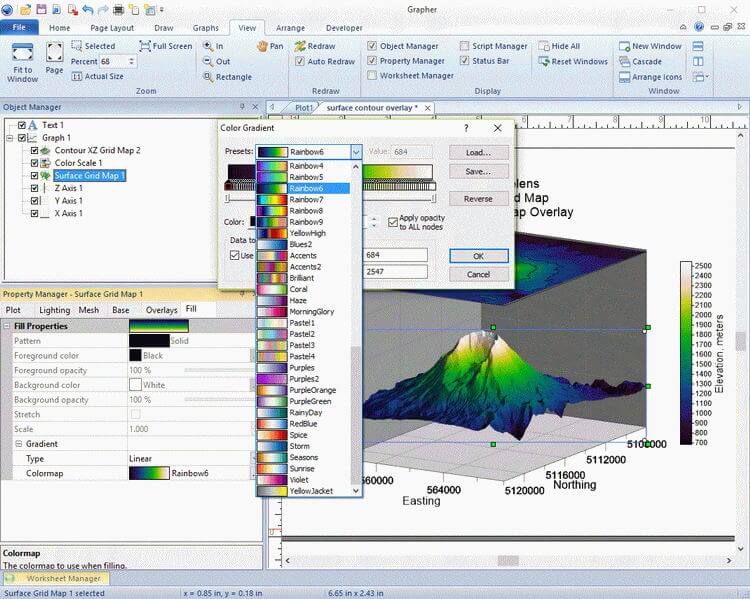
- Leverage 3D charting software capabilities to visualize data in three dimensions, offering new perspectives on data relationships and structures.
- Utilize specialized plot types such as ternary diagrams, contour plots, and rose diagrams for unique analytical needs.
- Employ advanced annotation tools to highlight critical data points, trends, or errors directly on the graph.
- Employ best practices in chart design, such as clear labeling, appropriate color schemes, and logical axis scaling, to maximize data comprehension.
Integration and Output Options
Golden Software Grapher is designed to integrate seamlessly into professional workflows, offering flexible output options that ensure compatibility and quality across various platforms and publishing needs.
- Supports export to a wide range of high-resolution raster and vector formats, including PNG, JPG, GIF, BMP, TIFF, PDF, EMF, and EPS.
- Vector output formats like PDF, EMF, and EPS are ideal for maintaining scalability and sharpness in print and professional publications without loss of quality.
- The software can export data and graphs in various formats, facilitating use in reports, presentations, and other applications.
Real-World Use Cases for Grapher
Professionals and researchers regularly turn to Golden Software Grapher to produce impactful visualizations for critical projects, demonstrating its utility in real-world applications.
- Geologists utilize Grapher to create cross-section plots and contour maps for geological surveys, aiding in resource exploration and land analysis.
- Biologists generate complex scatter plots and histograms to represent experimental results in scientific journals, supporting research findings.
- Engineers present performance data and simulation results using multi-panel graphs and 3D surface plots in technical reports and client presentations.
- Academics use the software to create custom charts for research papers, dissertations, and university lectures, enhancing educational material.
Conclusion: Why Choose Golden Software Grapher
Golden Software Grapher stands out as a premier graphing software for professionals demanding precision, flexibility, and high-quality output. Its extensive chart capabilities, deep customization options, and powerful automation features make it an essential tool for data visualization in scientific, engineering, and academic endeavors. For users seeking to elevate their data representation and create publication-ready graphs efficiently, downloading Golden Software Grapher offers a robust and reliable solution.
Frequently Asked Questions
What types of charts can I create with Golden Software Grapher?
Golden Software Grapher allows users to create over 60 unique chart types, including 2D and 3D charts such as bar, polar, and logarithmic graphs. It also supports advanced statistical visualizations like histograms and QQ plots, offering comprehensive graphing solutions for diverse data needs.
How can I customize my graphs in Golden Software Grapher?
Users can customize their charts extensively by adjusting colors, labels, annotations, and other graphical elements. The software features a Graph Wizard for more guided customization, alongside detailed formatting options for axes, legends, and plot areas, improving user experience and presentation quality.
What is the Script Recording feature in Grapher?
The Script Recording feature in Golden Software Grapher allows users to automate the chart creation process by recording actions taken within the application. This feature enhances productivity by enabling repetitive tasks to be completed more efficiently, saving time for complex analysis and reporting.


Reviews
There are no reviews yet.