Download Zond ZCGViewer – Advanced Geophysical Data Visualization Software
Zond ZCGViewer is a specialized software tool designed for the visualization and interpretation of geophysical data, primarily focusing on apparent resistivity measurements. Developed to aid professionals in geophysical surveying and environmental analysis, this software provides essential tools for solving geological problems through effective data representation. Its core function lies in transforming raw geophysical data into insightful graphical and map formats.
Introduction to ZCGViewer
Overview of Software
ZCGViewer serves as a critical application for geophysicists and earth scientists requiring robust data visualization capabilities. The software is specifically engineered to handle and display resistivity graphs, contour maps, and other related geophysical data formats. By offering a user-friendly interface, ZCGViewer aims to simplify the complex process of interpreting geophysical survey results, making geological analysis more accessible and efficient.
Applications in Geophysical Surveying
In the field of geophysical surveying, ZCGViewer plays a vital role by enabling detailed analysis of subsurface properties. It is particularly instrumental in processing data acquired from electromagnetic profiling systems. The software allows geoscientists to interpret spatial variations in electrical resistivity, which is fundamental for identifying geological structures, locating mineral deposits, and assessing environmental conditions beneath the Earth’s surface.
Features and Functional Capabilities
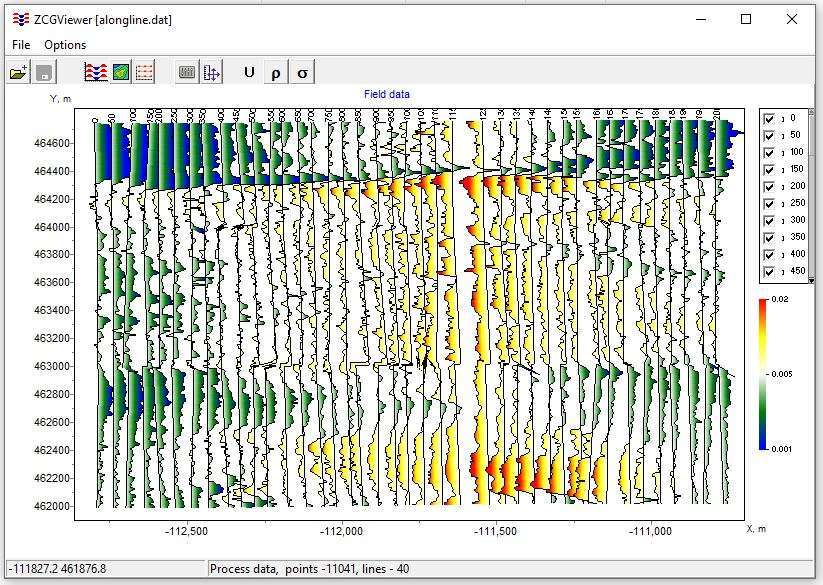
Data Visualization Techniques
ZCGViewer excels in its data visualization techniques, offering users a clear perspective on their geophysical findings. The software generates various graphical representations, including detailed resistivity graphs and comprehensive contour maps. These visualizations are designed for clarity and can be adapted to suit different geological contexts, aiding users in spotting anomalies and understanding subsurface strata more intuitively.
Integration with Electromagnetic Profiling Systems
A key functional capability of ZCGViewer is its flexibility in handling diverse data types and integrating observations from different geophysical systems. It is designed to work seamlessly with various electromagnetic profiling systems, accommodating a range of data formats. This data integration feature is crucial for comprehensive geological analysis, allowing users to combine information from multiple sources for a more complete understanding of an area.
Use Cases and Real-World Applications
ZCGViewer finds practical application in numerous real-world scenarios within geological and environmental studies. For instance, it can be utilized in projects aimed at mapping groundwater resources by identifying zones with specific resistivity signatures indicative of water content. It also supports the exploration for mineral and hydrocarbon deposits by highlighting anomalous resistivity patterns that may correlate with valuable resources. Furthermore, its utility extends to environmental assessments, such as mapping contaminant plumes or assessing buried infrastructure based on their distinct geophysical properties.
Comparative Analysis with Other Geophysical Tools
Compared to other geophysical software, ZCGViewer distinguishes itself through its specialized focus on visualizing apparent resistivity data and its broad compatibility with various electromagnetic profiling systems. While some tools offer a wider array of geophysical analysis modules, ZCGViewer prioritizes a user-friendly interface and efficient data representation for its core functions. This makes it a strong choice for professionals who need to quickly interpret resistivity datasets and integrate information from different sources without a steep learning curve.
Conclusion and Further Resources
Zond ZCGViewer is an indispensable tool for professionals engaged in geophysical surveying and geological analysis, offering robust data visualization capabilities for electromagnetic profiling data. Its emphasis on a user-friendly interface and broad data integration makes it a versatile asset for tackling complex geological challenges. For users seeking to further enhance their understanding and application of geophysical data visualization, exploring Zond Software’s official documentation or community forums may provide additional insights and technical support.
Frequently Asked Questions
What types of data can ZCGViewer visualize?
ZCGViewer primarily specializes in visualizing apparent resistivity data obtained from electromagnetic profiling systems. However, it is also capable of processing and displaying other types of geophysical data, such as information from gravity and magnetic surveys, thereby supporting a comprehensive approach to geological analysis.
Is ZCGViewer suitable for non-experts in geophysics?
Yes, ZCGViewer is designed with a user-friendly interface that simplifies the visualization of complex geophysical data. This accessibility makes it suitable for users with varying levels of expertise, including those who may be newer to the field of geophysics.
How does ZCGViewer handle data from different geophysical systems?
ZCGViewer employs a straightforward and clear data format that facilitates easy integration of data from various electromagnetic profiling and other geophysical systems. This design enhances its versatility and utility in diverse geological survey applications.


Reviews
There are no reviews yet.