
Download GraphPad Prism 10.6 – Advanced Statistical Analysis Software
GraphPad Prism 10.6 is a powerful commercial scientific software developed by GraphPad Software Inc. (now Insightful Science), designed for statistical analysis and data visualization. Introduced in 1989, this application is extensively used in fields such as biostatistics, scientific research, academia, and the pharmaceutical industry for its comprehensive approach to data interpretation and presentation. The software facilitates complex analyses, nonlinear regression, and robust data graphing, making it an essential tool for researchers seeking to derive meaningful insights from their experimental data.
Introduction to GraphPad Prism
Overview and History
GraphPad Prism, first released in 1989, has evolved into a leading application for scientists and researchers worldwide. Developed by GraphPad Software Inc., now part of Insightful Science, it has consistently provided advanced statistical analysis and graphing capabilities. Over the decades, Prism has refined its features, maintaining a focus on ease of use and powerful analytical functions, making it a staple in scientific laboratories and academic institutions.
The software’s journey from its inception to the current version, 10.6, reflects a commitment to supporting the evolving needs of scientific research. Its widespread adoption by professionals in biostatistics, pharmaceuticals, and academic research underscores its reliability and effectiveness in handling complex datasets and generating clear, interpretable results.
Core Statistical Capabilities
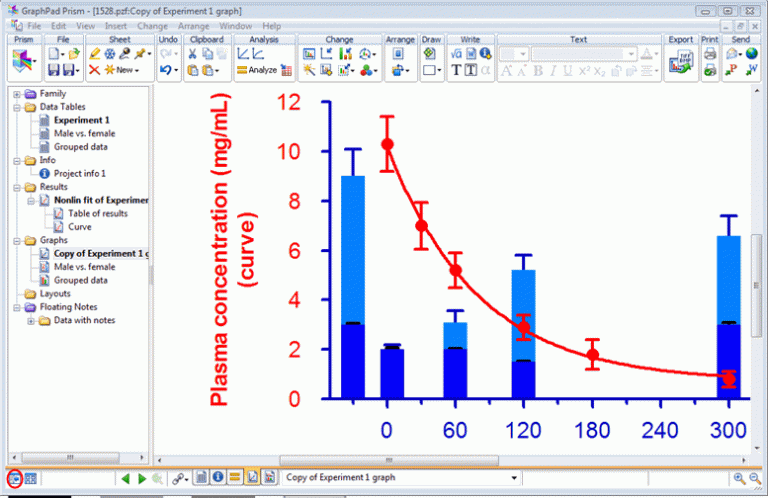
Nonlinear Regression and Model Comparisons
A cornerstone of GraphPad Prism’s functionality is its advanced nonlinear regression engine. This capability allows researchers to fit complex biological and chemical models to their experimental data, going beyond simple linear assumptions. The software provides a comprehensive suite of statistical models, enabling users to select the most appropriate one for their specific research question.
GraphPad Prism excels in comparing different statistical models fitted to the same dataset, offering statistical tests to determine which model provides the best fit. This is crucial in research where understanding the underlying processes and making accurate predictions are paramount. Furthermore, its interpolation functions can estimate values within the range of experimental data, providing valuable endpoints for analysis.
Data Visualization and Graphing Tools
Creating and Editing Graphs
GraphPad Prism empowers users to create a wide array of professional-quality scientific graphs, essential for visualizing data and communicating research findings. The software supports dynamic graph adjustments, allowing users to modify graph parameters, labels, and styles with ease, ensuring clear and accurate data representation. Specialized graphing options, including the precise placement and editing of error bars, help in accurately depicting data variability and statistical significance.
The flexibility in graph creation extends to dynamic data tables that update graphs automatically as data is modified. This feature is particularly useful for iterative analysis and presentation refinement. Users can generate various plot types, such as scatter plots, bar graphs, and survival curves, each customizable to meet specific publication or presentation requirements.
Support for Diverse Analytical Needs
Batch Processing and Automation Features
Designed to enhance efficiency in research settings, GraphPad Prism incorporates robust batch processing capabilities. This feature allows users to perform the same analysis or graph generation on multiple datasets simultaneously, significantly reducing the time spent on repetitive tasks. By automating these processes, Prism enables researchers to analyze larger volumes of data more effectively.
The software’s automation extends to performing a series of linked analyses with a single command, facilitating standardized workflows. This is particularly beneficial in environments requiring consistent data validation and reporting across numerous experiments or research projects. The ability to automate complex analytical sequences saves valuable researcher time and minimizes the potential for human error.
Industrial Applications and Use Cases
GraphPad Prism is widely adopted across various scientific sectors due to its specialized analytical features and user-friendly interface. In biomedical research, it is instrumental for analyzing experimental data from cell cultures, animal models, and clinical trials. Researchers use it to perform statistical comparisons, fit dose-response curves, and visualize complex biological phenomena.
The pharmaceutical industry relies heavily on GraphPad Prism for drug discovery and development. Its nonlinear regression and curve-fitting capabilities are essential for pharmacokinetic and pharmacodynamic studies, as well as for analyzing the efficacy and safety of new drug candidates. Model comparison features aid in selecting the most promising compounds for further development and in understanding drug mechanisms of action in clinical studies.
Conclusion and User Community
Resources for Learning and Support
GraphPad Prism offers a comprehensive ecosystem of learning resources and community support to assist users at all levels. The developer provides extensive documentation, tutorials, and knowledge bases that cover a wide range of statistical concepts and software functionalities. These resources are invaluable for both new users getting acquainted with the software and experienced users looking to master advanced features.
Online forums and user communities offer platforms for researchers to exchange insights, ask questions, and share solutions related to data analysis andGraphPad Prism usage. This collaborative environment fosters continuous learning and problem-solving, ensuring users can maximize the software’s potential for their scientific endeavors. The availability of such support networks solidifies Prism’s position as a leader in scientific statistical software.
Frequently Asked Questions
What types of statistical analysis can GraphPad Prism perform?
GraphPad Prism specializes in biostatistical analysis, including nonlinear regression, curve fitting, and comparison of statistical models. It also supports a variety of graphical representations for data visualization, enabling researchers to effectively present their findings.
Is GraphPad Prism suitable for beginners in statistical analysis?
Yes, while GraphPad Prism is designed for advanced statistical tasks, it provides user-friendly features and guides that make it accessible for beginners as well. Educational resources are available for self-learning, helping new users to quickly grasp its functionalities.
What operating systems does GraphPad Prism support?
GraphPad Prism is compatible with both Windows and macOS, ensuring flexibility for users across different platforms and enabling seamless integration into diverse research environments.


Reviews
There are no reviews yet.